
CMF reports on the performance of supervised banks and cooperatives as of September 2026
October 29, 2026 - The Financial Market Commission (CMF) published today its Report on the Performance of the Banking System and Cooperatives as of September 2026. It contains data about activity, risk, and results of supervised banks and cooperatives. Key figures are presented below, while the full report is available here.
| Results of the Banking Industry |
| Loans |
|---|
|
USD 297,749 million 0.93% Real variation over 12 months |
| Risk Indices | |
|---|---|
|
Loan-Loss Provisions Index |
|
|
2.49% |
|
|
Arrears Ratio of 90 Days or More |
Impaired Portfolio Ratio |
|
2.36% |
5.81% |
| Profits |
|---|
|
USD 4,616 million 2.78% Real variation over 12 month |
At the end of September 2026, loans in the banking system posted an increase of 0.93 percent in real terms over the past 12 months. This trend is linked to the consumer portfolio - which grows by 1.57 percent in that span - along with the slight expansion observed in housing loans. On the other hand, commercial lending saw a steeper decline in activity during the same period. (Graph 1).
Graph 1.
Total loans and loans by portfolio, banking system
(Real annual variation expressed in percentage)
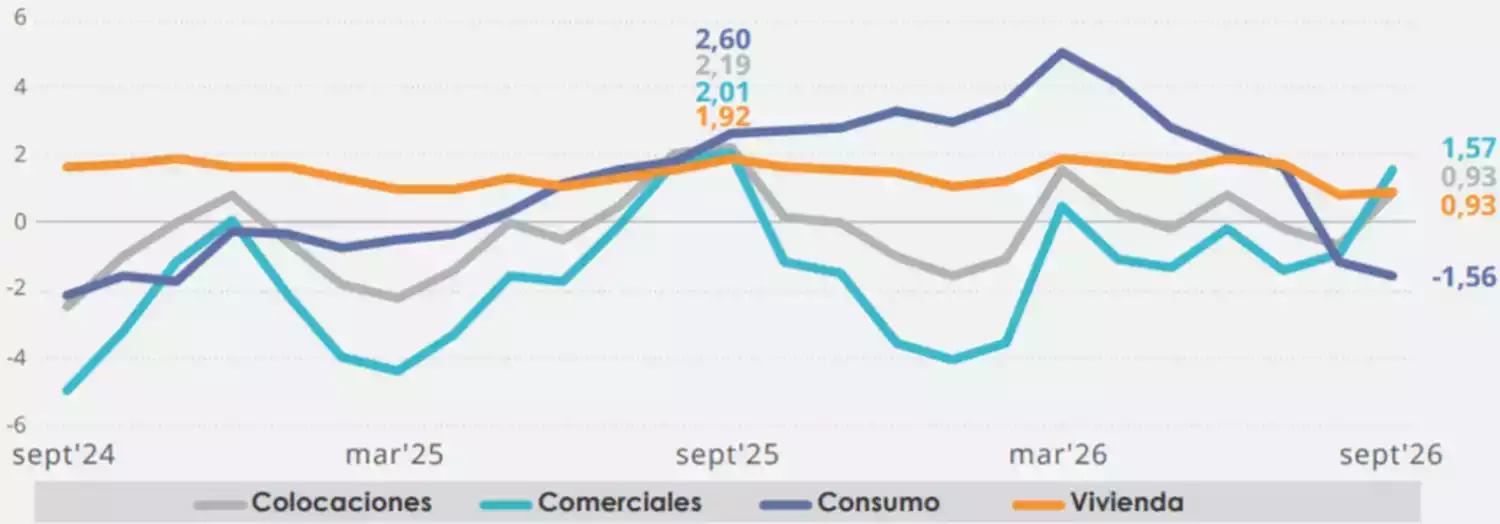
Gray: Total loans. Aqua: Commercial loans. Purple: Consumer loans. Orange: Housing loans.
Compared to August, credit risk indices show a mostly downward trend at the aggregate level. In fact, the Loan-Loss Provisions Index (LLPI) fell to 2.49 percent (2.51 percent in August 2026) and the Impaired Portfolio Ratio (IPR) to 5.81 percent (5.88 percent in August 2026). Meanwhile, the Arrears Ratio of 90 Days or More (AR90) increased to 2.36 percent (2.34 percent in August 2026).
By loan portfolio, the trends are mixed - all consumer loan indices rise; commercial indices fall except the AR 90, which rises; and housing indices display uneven behavior as the LLPI increases, the IPR falls, and the AR90 shows no variation.
Compared to twelve months ago, the trend is also mixed: commercial loans show only declines, but consumer and housing loans show mostly increases (see Page 4 of the Performance Report).
Provisions coverage declined both during the month and compared to 12 months ago.
The growth in cumulative profits is primarily due to increases in the interest and readjustment margin, and to a lesser extent, to other operating income and higher net fee income. Similarly, higher expenses for credit losses and a lower net financial result were recorded in that span. However, average profitability indicators decline compared to the previous month: the Return on Average Equity (ROAE) falls to 15.07 percent and the Return on Average Assets (ROAA) stands pat at 1.34 percent.
| Results of Savings and Credit Cooperatives |
| Loans |
|---|
|
USD 3,846 million 5.15% Real variation over 12 months |
| Risk Indices | |
|---|---|
|
Provisions Index |
|
|
4.13% |
|
|
Arrears Ratio of 90 Days or More |
Impaired Portfolio Ratio |
|
2.5% |
8.11% |
| Results |
|---|
|
USD 88 million -3.08% Real variation over 12 month |
As for cooperatives, lending growth is below the levels recorded in both August and 12 months ago. The change from the previous month is due to a slower growth in consumer loans - representing 66.67 percent of total operations - which closed September with a 1.2 percent rate (1.49 percent in August 2026). Meanwhile, housing and commercial loans post increases versus the preceding month. (Graph 2).
Graph 2: Total loans and loans by portfolio, savings and credit cooperatives
(Real annual variation expressed in percentage)
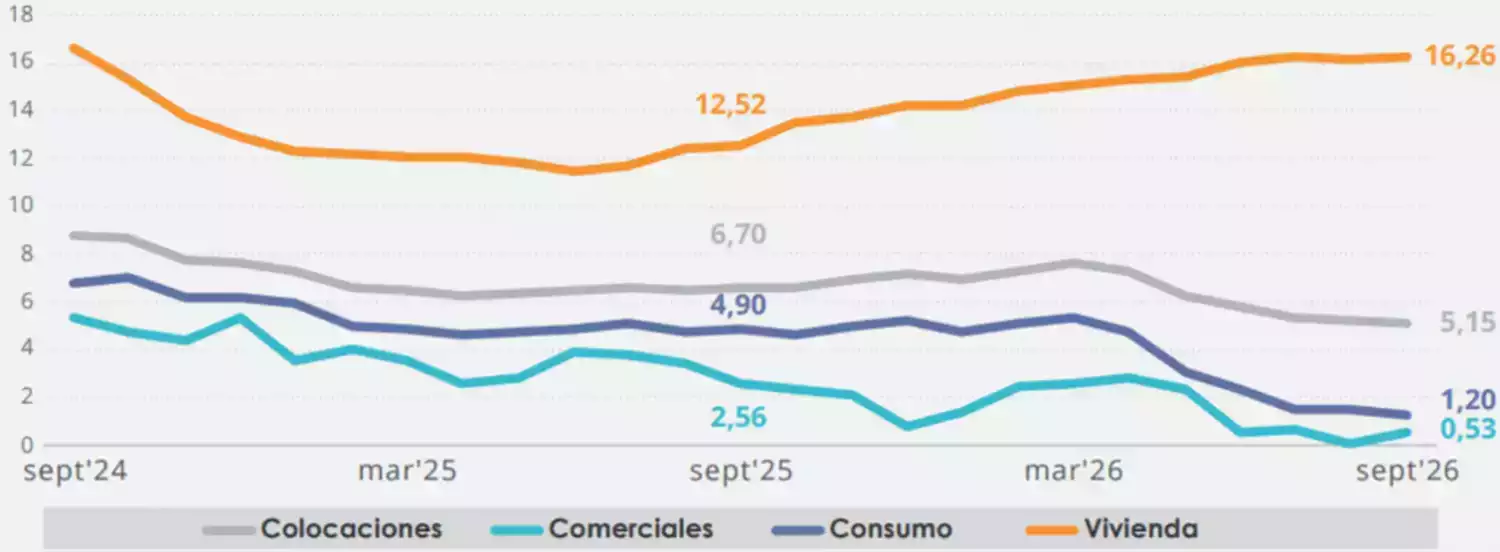
Gray: Total loans. Aqua: Commercial loans. Purple: Consumer loans. Orange: Housing loans.
Compared to August and on an aggregate basis, credit risk indices show a non-downward trend: the Provisions Index (PI) and the IPR record no variation at 4.13 and 8.11 percent, respectively, while the AR90 increases from 2.46 to 2.5 percent.
The consumer and commercial portfolios' indices trend upward. Housing indices show mostly declines except the PI, which does not vary for housing and commercial loans (see Page 7 of the Performance Report).
The cumulative result reported in September declines primarily due to higher net provision expenses, lower net fees, and higher support expenses. On the other hand, this month also saw an increase in the interest margin. In line with cumulative performance through September 2026, average profitability metrics fell compared to twelve months ago. Thus, the ROAA stands at 2.39 percent and the ROAE at 11.65 percent.
CMF reports on the performance of supervised banks and cooperatives as of September 2026
(Formato: pdf) | (Peso: 168.5 kb)