
CMF reports on average repair time for motor vehicles as of the first half of 2026
The average time from filing the claim until the vehicle was available for pickup by policyholders was 51.6 days between January and June 2026, continuing the downward trend that began in 2023.
The CMF makes available to the public a platform on its website that allows easy comparison of days that a vehicle takes to be repaired. It provides data by insurance company; vehicle brand and model; region where the vehicle is insured; and workshop type.
September 15, 2026 - The Financial Market Commission (CMF) reports on the average repair time of motor vehicles as of the first half of 2026. Data is compiled from reports submitted by insurance biannually pursuant to Circular Letter No. 2,236, which regulates the submission of information related to motor vehicle repair procedures.
To facilitate access to this data, the Commission has a platform on its website for users to check and compare repair times for vehicles insured by supervised companies. Transparent, useful data is available to policyholders, insurance brokers, and the public to make better decisions when taking out or assessing insurance.
The platform contains detailed information on the number of insured vehicles; reported claims; repair times by company; and magnitude of the damage, as well as an updated list of current workshops in the country.
Results
88,991 insured vehicles suffered accidents in the first half of 2026 - practically no variation versus the previous half (89,084 cases).
The average time from filing a claim until the vehicle is available for pickup by the policyholder was 51.6 days, which is the best performance in the last four years. Accordingly, the average time between filing a claim and entering the vehicle into a workshop was 29.8 days, slightly increasing compared to said reference period.
Average time from filing the claim until the vehicle is available for pickup by the policyholder (2018- Q2 2026)
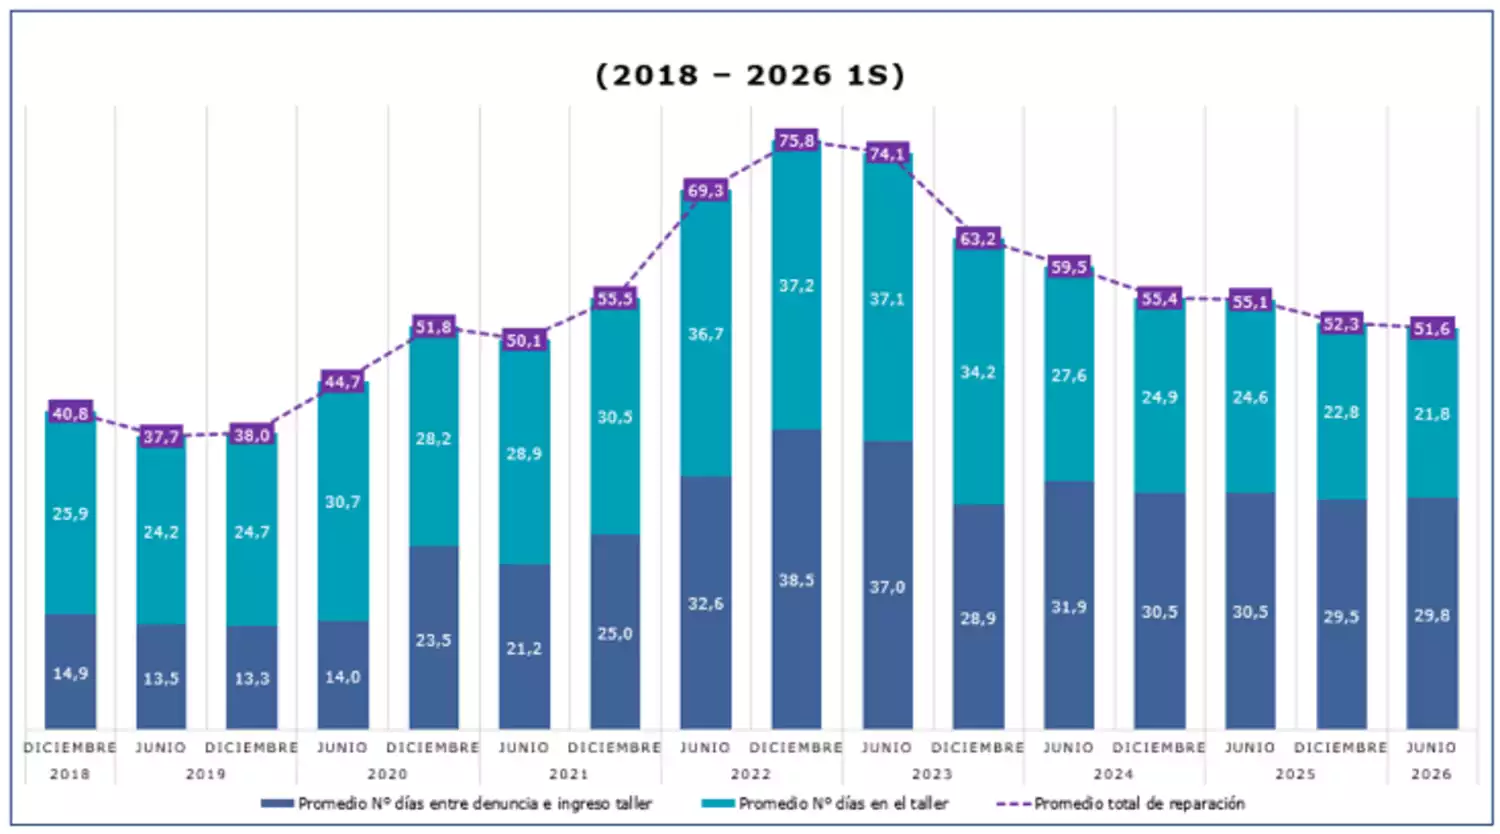
Blue: Average days between filing the claim and sending the vehicle to a workshop. Green: Days the vehicle spent in the workshop. Dotted Purple: Total average repair time.
Average days in workshops and number of vehicles with filed claims by half (2018- Q2 2026)
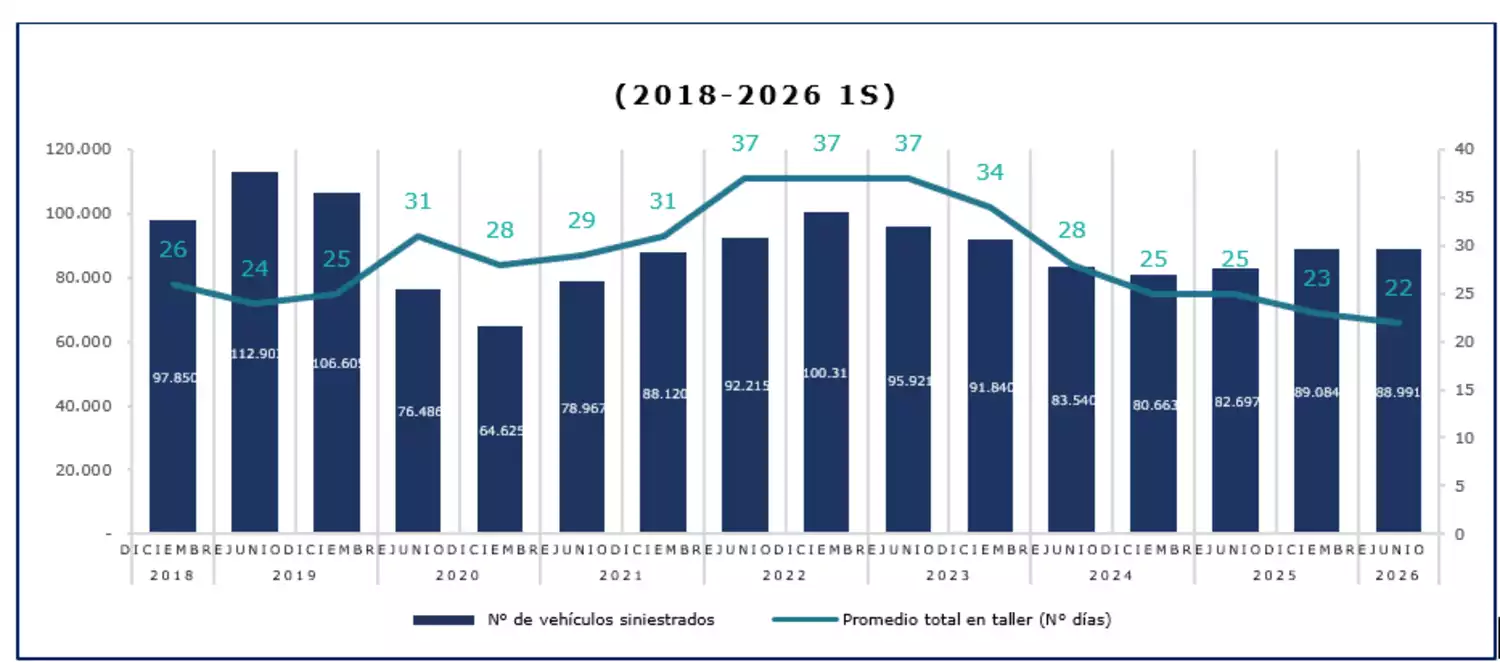
Blue: Number of vehicles with claims. Green: Average days vehicles spent in workshops.
Repair times by insurance company vary significantly depending on the extent of damage to vehicles, as this table shows.
Average time, by company, elapsed from date of claim until date when vehicle became available to policyholders
|
Company |
Light Damage |
Medium Damage |
Heavy Damage |
Total |
||||
|
Vehicles w/ Claims |
Avg. Days |
Vehicles w/ Claims |
Avg. Days |
Vehicles w/ Claims |
Avg. Days |
Vehicles w/ Claims |
Avg. Days |
|
|
BCI |
14,173 |
42.6 |
8,579 |
51.8 |
6,999 |
68.7 |
29,751 |
51.4 |
|
HDI G |
11,097 |
45.7 |
6,026 |
55.2 |
5,654 |
66.7 |
22,777 |
53.4 |
|
Zurich Chile G |
4,570 |
45.0 |
2,364 |
54.8 |
2,311 |
69.2 |
9,245 |
53.6 |
|
Consorcio Nacional |
4,069 |
41.1 |
1,819 |
51.2 |
1,313 |
65.7 |
7,201 |
48.1 |
|
Suramericana G |
2,335 |
44.3 |
1,632 |
52.2 |
1,283 |
59.8 |
5,250 |
50.5 |
|
Zenit |
1,813 |
41.1 |
1,042 |
49.9 |
806 |
70.5 |
3,661 |
50.1 |
|
Mapfre |
1,369 |
44.4 |
712 |
57.8 |
508 |
70.1 |
2,589 |
53.1 |
|
FID |
1,239 |
47.9 |
666 |
56.3 |
621 |
66.9 |
2,526 |
54.8 |
|
Reale |
1,035 |
36.7 |
680 |
47.4 |
616 |
60.4 |
2,331 |
46.1 |
|
BNP |
929 |
40.0 |
538 |
50.3 |
309 |
55.9 |
1,776 |
45.9 |
|
Renta Nacional |
716 |
42.8 |
358 |
51.5 |
288 |
64.5 |
1,362 |
49.7 |
|
Porvenir |
222 |
36.5 |
136 |
54.4 |
164 |
63.2 |
522 |
49.6 |
|
Total |
43,567 |
43.5 |
24,552 |
53.0 |
20,872 |
67.0 |
88,991 |
51.6 |
As of the first half of 2026, there are 4,627 workshops under agreements with supervised insurance companies. 31.92 percent of total workshops are in the Metropolitan Region, and the rest across the country.
Do note that these workshops are not company-exclusive, so one may have working agreements with multiple insurers. This means that the number of workshops does not necessarily match the number of unique establishments but the number of agreements in force between companies and workshops.
The presence of workshops in regions such as Valparaíso, Biobío, Maule, and Los Lagos shows the service network's territorial reach, although density varies depending on the area.
Number of repair points available by region
|
Region |
Repair Points |
% of Total |
|
Arica y Parinacota |
37 |
1 |
|
Tarapacá |
99 |
2 |
|
Antofagasta |
269 |
6 |
|
Atacama |
130 |
3 |
|
Coquimbo |
200 |
4 |
|
Valparaíso |
476 |
10 |
|
Metropolitana |
1,477 |
32 |
|
Libertador Bernardo O'Higgins |
257 |
6 |
|
Maule |
331 |
7 |
|
Ñuble |
128 |
3 |
|
Biobío |
365 |
8 |
|
Araucanía |
171 |
4 |
|
Los Ríos |
119 |
3 |
|
Los Lagos |
407 |
9 |
|
Aysén |
53 |
1 |
|
Magallanes |
108 |
2 |
|
Total |
4,627 |
100 |
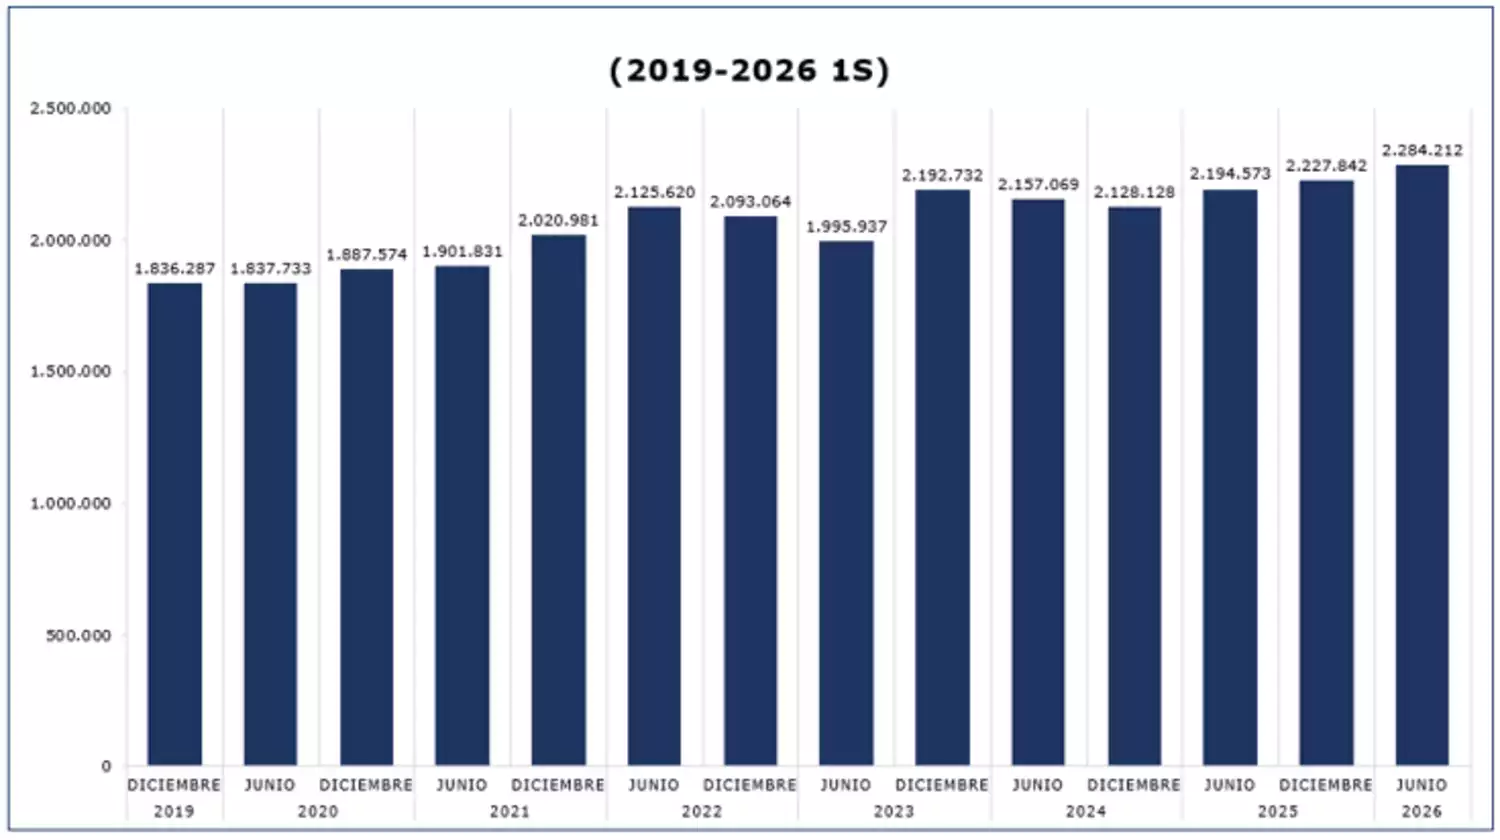
The total number of insured vehicles nationwide as of the first half of 2026 is 2,284,212 - an increase of over 56,000 versus the preceding half. It is the largest insured universe ever recorded, reflecting a general upward trend in the vehicle insurance market during recent years.
Number of insured vehicles by half (2019- Q2 2026)
CMF reports on average repair time for motor vehicles as of the first half of 2026
(Formato: pdf) | (Peso: 489.5 kb)