
CMF updates its Mutual Funds Portal with information as of June 2026
October 16, 2026 - The Financial Market Commission (CMF) updated its Mutual Funds Portal with information as of June 2026. This Portal aims to ensure that both investors and users of the financial system have all the relevant information they need to make decisions.
Check the updated modules of the Mutual Funds Portal here.
|
Results of the Mutual Fund Industry |
|||
|
Figures as of June 30, 2026 |
|||
|
Managed Equity +6.1 percent Biannual variation |
System Annual Cost Rate +5 base points Biannual variation |
Participants 3.95 million |
Number of Marketed Funds -2.4 percent Biannual variation |
Figures in Chilean pesos and deflacted by UF. Equity converted to US dollars at the exchange rate on the closing date.
As of June 2026, the equity managed by the mutual fund industry amounts to USD 100,884 million - an increase of 6.1 percent this year - distributed in 441 funds. This expansion is mainly due to foreign share funds (+11.4 percent) and, to a lesser degree, domestic share funds (+10.8 percent). By investor type, institutional series recorded the largest participation increase (+0.6 percent), while retail series recorded a decrease of 0.2 percent. The latter series constitutes 40.9 percent of the managed total.
The number of participants reached 3.95 million, an increase of 4.2 percent as of the first half of this year. Retail participants hold the largest share in the system with over 74.3 percent, followed by voluntary pension savings (22 percent) and high-income participants (3.3 percent).
As for costs, the system's average Annual Cost Rate (ACR) increased by 5 base points (BP) to 1.1 percent. By fund family, it's worth highlighting the 5 BP increase in "Debt < 90 Days" in contrast with a 14 BP decrease in "Foreign Share," as Graph 1 shows. Meanwhile, the average ACR for digital series for retail investors (1.2 percent) is lower than that of their non-digital counterparts (1.6 percent), a saving of 33 BP.
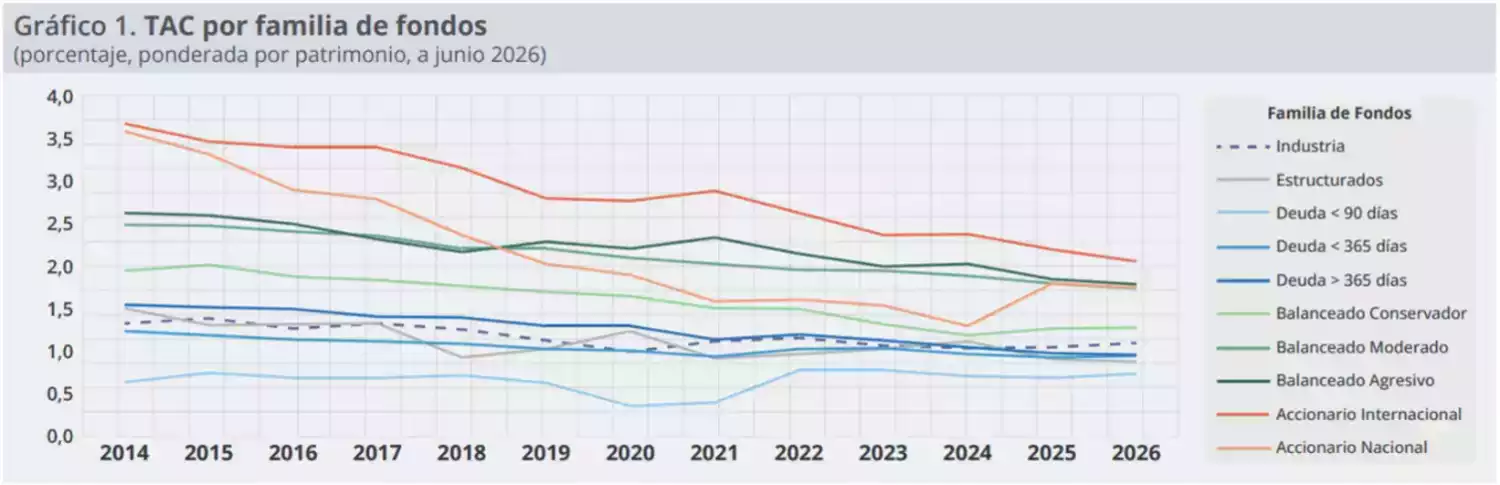
Fund families from top to bottom: Industry; Structured; Debt < 90 Days; Debt < 365 Days; Debt > 365 Days; Balanced - Conservative; Balanced - Moderate; Balanced - Aggressive; Foreign Shares; Domestic Shares.
Regarding net profitability for fees and expenses, the "Foreign Share" family posts the highest increase at 11.9 percent (8.9 percent in real terms), followed by "Balanced - Aggressive" at 10.9 percent (7.9 percent in real terms). On the other end, the "Debt < 90 Days" family posted a profitability of only 1.99 percent (-0.7 percent in real terms), followed by "Debt < 365 Days" at 2.4 percent (-0.3 percent in real terms), as Graph 2 shows.
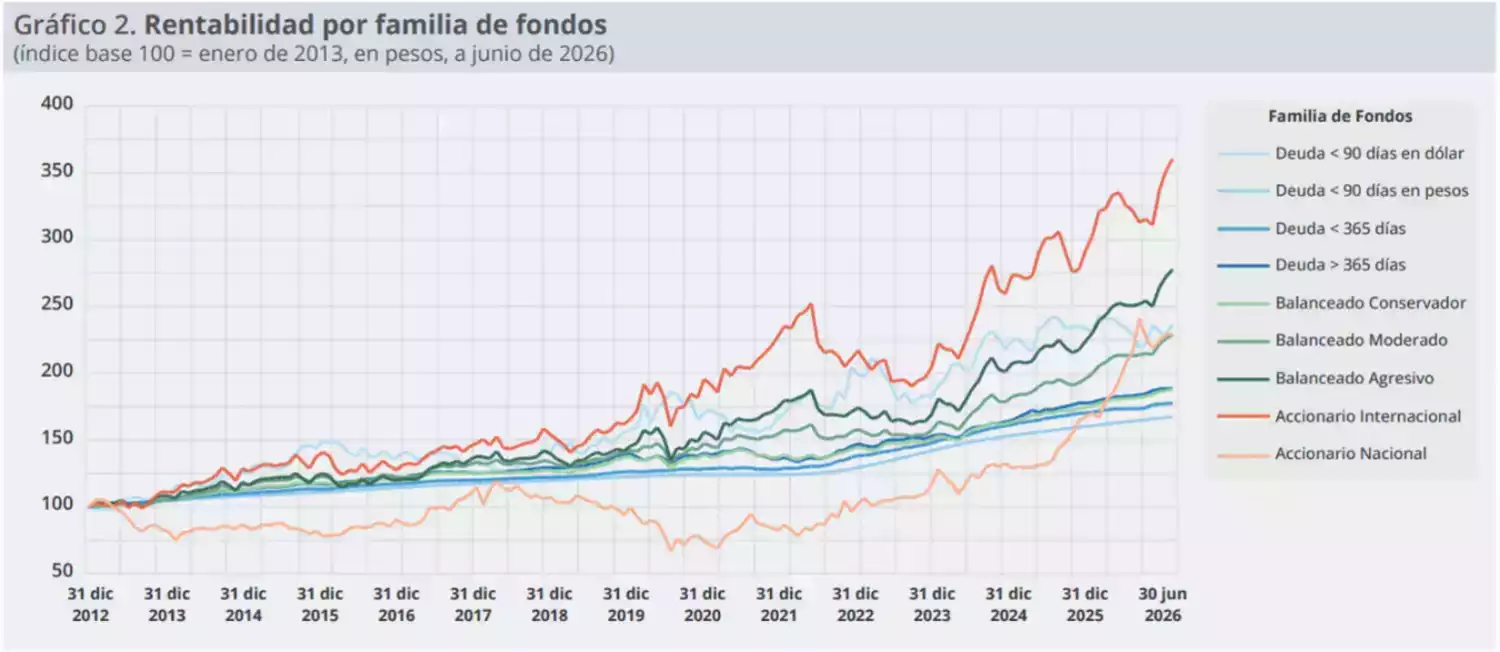
CMF updates its Mutual Funds Portal with information as of June 2026
(Formato: pdf) | (Peso: 226.2 kb)