
CMF reports the performance of supervised banks and cooperatives as of June 2026
July 30, 2026 - The Financial Market Commission (CMF) published today its Report on the Performance of the Banking System and Cooperatives as of June 2026. It contains data about activity, risk, and results of supervised banks and cooperatives. Key figures are presented below, while the full report is available here.
| Results of the Banking Industry |
| Loans |
|---|
|
USD 307,154 million 0.78% Real variation over 12 months |
| Risk Indices | |
|---|---|
|
Loan-Loss Provisions Index |
|
|
2.53% |
|
|
Arrears Ratio of 90 Days or More |
Impaired Portfolio Ratio |
|
2.41% |
5.95% |
| Profits |
|---|
|
USD 3,587 million 10.87% Real variation over 12 month |
Loans in the banking system as of June 2026 grew compared to last month, posting an increase of 0.78 percent in real terms over 12 months. This was due to a slower decline in the commercial portfolio. Consumer loans grew for the 14th consecutive month, while housing loans grew slightly and at a lower rate than that of May (Graph 1).
Graph 1. Total loans at amortized cost and loans by portfolio, banking system
(Real annual variation expressed in percentage)
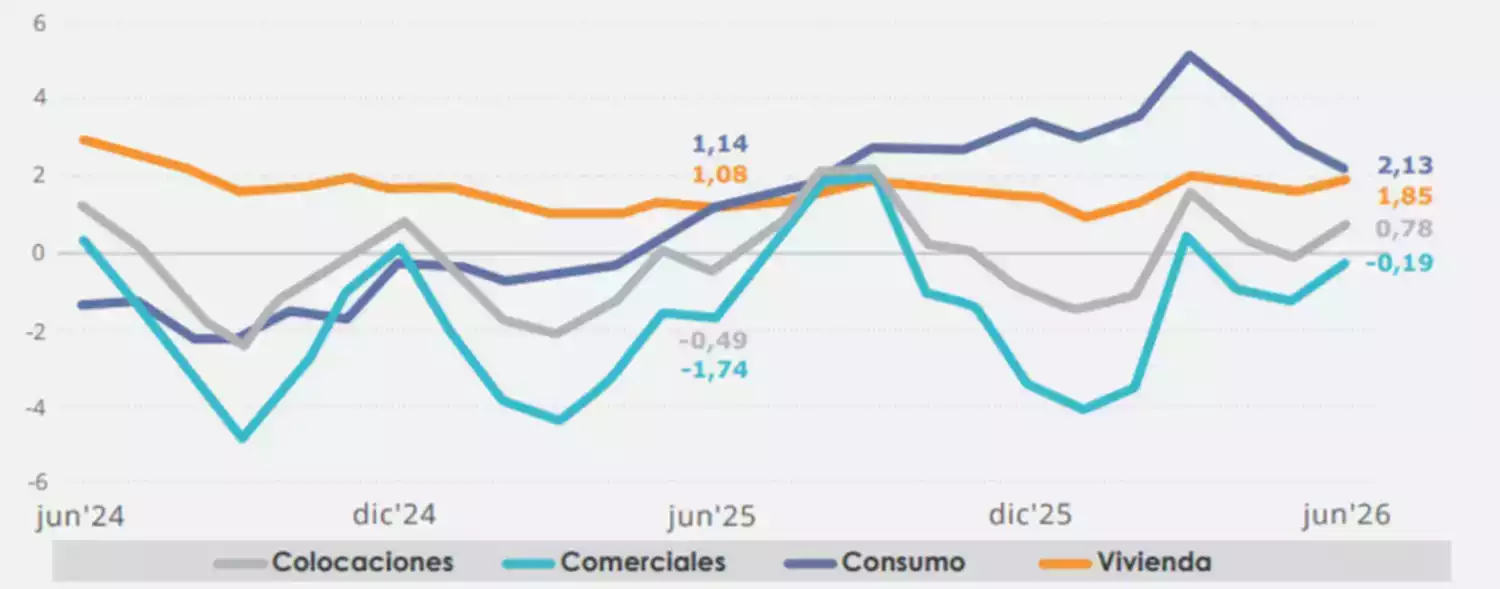
Gray: Total loans. Aqua: Commercial loans. Purple: Consumer loans. Orange: Housing loans.
Aggregate credit risk indices mostly grew versus May. The Loan-Loss Provisions Index (LLPI) showed no variation at 2.53 percent while the Arrears Ratio of 90 Days or More (AR90) increased to 2.41 percent (2.36 percent in May) and the Impaired Portfolio Ratio (IPR) decreased to 5.95 percent (5.96 percent in May). Increases were recorded across all portfolios except for a few cases: the IPR fell for commercial loans and the LLPI for consumer loans, and the LLPI for housing loans stood pat.
Indices by portfolio showed uneven behavior versus 12 months ago as most of them decrease for commercial and consumer loans while increasing for housing loans (see Page 4 of the Performance Report).
Provisions coverage decreased both during the month and compared to 12 months ago.
Cumulative profits grew because of an increased interest and readjustment margin paired up with better net financial results and other operational incomes There were also increased tax and loan loss expenses in the period. Profitability indices rose in turn: the return on average equity (ROAE) to 15.74 percent and the return on average assets (ROAA) to 1.4 percent.
| Results of Savings and Credit Cooperatives |
| Loans |
|---|
|
USD 3,978 million 5.82% Real variation over 12 months |
| Risk Indices | |
|---|---|
|
Provisions Index |
|
|
4.11% |
|
|
Arrears Ratio of 90 Days or More |
Impaired Portfolio Ratio |
|
2.32% |
8.25% |
| Results |
|---|
|
USD 67 million -5.48% Real variation over 12 month |
As for cooperatives, loans increased at a lower rate than those of both May and 12 months ago. This was due to lower growth in the consumer portfolio, which represents 67.25 percent of total operations, of just 2.32 percent in real terms (Graph 2).
Graph 2: Total loans and loans by portfolio, savings and credit cooperatives
(Real annual variation expressed in percentage)
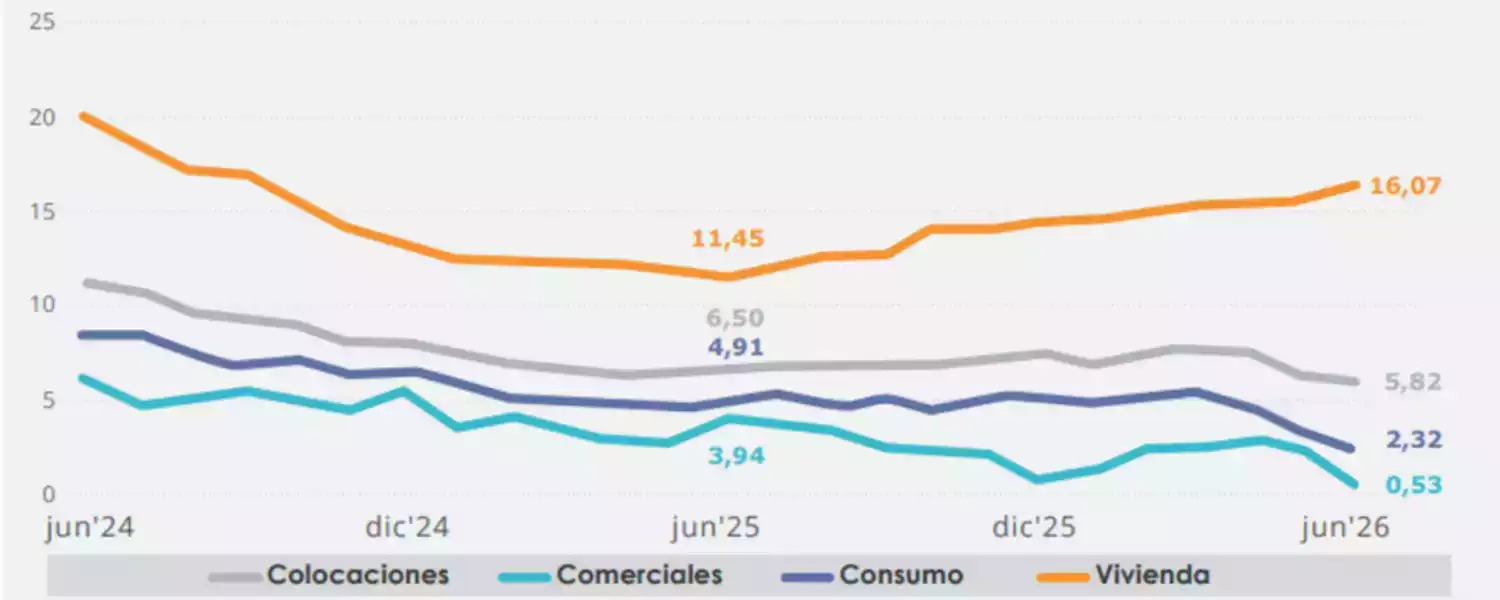
Gray: Total loans. Aqua: Commercial loans. Purple: Consumer loans. Orange: Housing loans.
Aggregate credit risk indices behaved unevenly compared to May. The Provisions Index (PI) moved to 4.11 percent (4.1 percent in May); the AR90 grew to 2.32 percent (2.29 percent in May); and the IPR fell to 8.25 percent (8.37 percent in March).
Indices by portfolio mostly fall with some exceptions. The PI grew for consumer loans, as did the AR90 for commercial loans. Meanwhile, the PI showed no variation for housing loans (see Page 7 of the Performance Report).
Cumulative results posted in June declined due to increased net provision expenses and lower net fees despite better financial operation results and increased interest margins. In line with these results as of June 2026, profitability indices fall compared to 12 months ago as the ROAA declines to 2.39 percent and the ROAE to 11.71 percent.
CMF reports the performance of supervised banks and cooperatives as of June 2026
(Formato: pdf) | (Peso: 158 kb)