
CMF reports the performance of supervised banks and cooperatives as of May 2026
June 26, 2026.- The Financial Market Commission (CMF) publishes the Performance Report of the Banking System and Cooperatives as of May 2026, which presents figures on the activity, risk, and results of supervised banks and cooperatives. Below is a selection of key figures, and the full report can be accessed at the following link.
| Results of the Banking Industry |
| Loans |
|---|
|
USD 312,947 million -0.17% Real variation over 12 months |
| Risk Indices | |
|---|---|
|
Loan-Loss Provisions Index |
|
|
2.53% |
|
|
Arrears Ratio of 90 Days or More |
Impaired Portfolio Ratio |
|
2.38% |
5.96% |
| Profits |
|---|
|
USD 3,092 million 10.12% Real variation over 12 month |
At the close of May 2026, loan placements in the banking system register a decline relative to the rate observed the previous month, posting a real -0.17% over twelve months. This behavior is primarily associated with the decline in the commercial portfolio. Likewise, consumer loans register thirteen consecutive months of growth, although at a slower pace than the previous month, while housing loans present a slight increase, somewhat lower than that of April (Chart 1).
Chart 1. Loan placements at amortized cost of the Banking System, by portfolio type
(real 12-month variation, percentage)
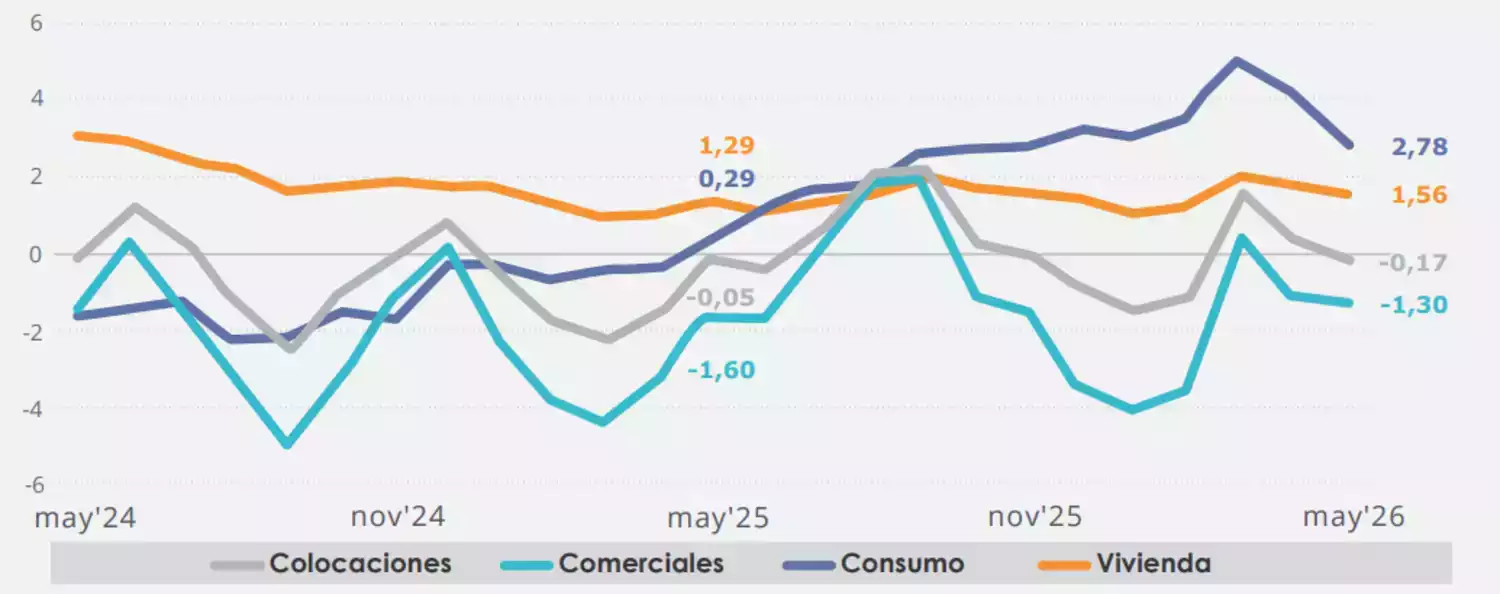
Gray: Total loans. Aqua: Commercial loans. Purple: Consumer loans. Orange: Housing loans.
Relative to April, at the aggregate level, credit risk indicators exhibit mixed behavior: the provisions indicator decreases, posting 2.53% (2.55% Apr '26), as does the impaired portfolio indicator, which reaches 5.96% (5.99% Apr '26). Meanwhile, the indicator for the portfolio 90 or more days past due increases to 2.38% (2.37% Apr '26).
By portfolio, a disparity is observed: in the commercial portfolio, all indicators decrease, whereas in consumer and housing they increase, with the exception of the housing provisions indicator, which also decreases.
Relative to twelve months prior, an uneven behavior is observed: in commercial and consumer portfolios, decreases predominate, whereas in housing, increases prevail (see page 4 of the Performance Report).
Regarding provision coverage, it decreases both for the month and relative to twelve months ago.
The growth in accumulated profit is primarily due to increases in the interest and indexation margin, the net financial result, and other operating income. In the same period, higher credit loss expenses and taxes are recorded. Consequently, average profitability indicators show an increase relative to the previous month: Return on Average Equity (ROAE) reaches 15.58% and Return on Average Assets (ROAA) posts 1.38%.
| Results of the Cooperatives |
| Loans |
|---|
|
USD 4,077 million 6.29% Real variation over 12 months |
| Risk Indices | |
|---|---|
|
Provisions Index |
|
|
4.10% |
|
|
Arrears Ratio of 90 Days or More |
Impaired Portfolio Ratio |
|
2.29% |
8.37% |
| Results |
|---|
|
USD 59 million -0.82% Real variation over 12 month |
In the case of cooperatives, loan placements exhibit growth below that recorded both in April and twelve months prior. This behavior is explained by the lower growth observed in consumer loans-whose share relative to total loan placements amounts to 67.53%-which registers a real 12-month growth of 3.11% (Chart 2).
Chart 2. Loan placements of the Cooperatives, by portfolio type
(real 12-month variation, percentage)
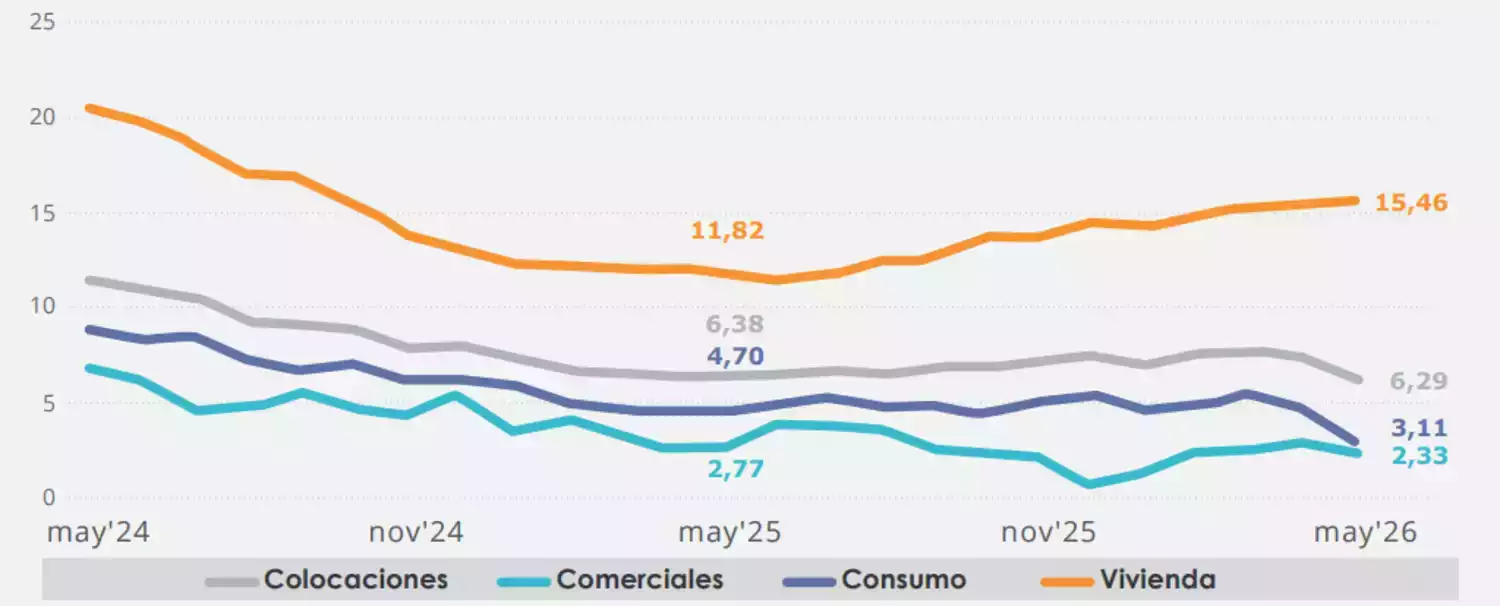
Gray: Total loans. Aqua: Commercial loans. Purple: Consumer loans. Orange: Housing loans.
Compared to April and at the aggregate level, credit risk indicators exhibit a mixed trajectory: the provisions indicator increases to 4.10% (4.07% Apr '26) and the indicator for the portfolio 90 or more days past due to 2.29% (2.20% Apr '26), while the impaired portfolio indicator decreases to 8.37% (8.45% Apr '26).
Across the portfolios, a primarily downward trend is observed with some exceptions: in consumer loans, the indicators for provisions and the portfolio 90 or more days past due increase, whereas in housing loans, the provisions indicator remains unchanged (see page 7 of the Performance Report).
The accumulated result recorded in May decreases, primarily due to higher net provision expenses and lower net fee income. On the other hand, an increase in the interest margin and a higher result from financial operations are also observed during this month. In line with the accumulated performance as of May 2026, average profitability indicators decrease relative to twelve months prior. Thus, the ROAA reaches 2.46% and the ROAE 12.04%.
CMF reports the performance of supervised banks and cooperatives as of May 2026
(Formato: pdf) | (Peso: 149.6 kb)