August 28, 2025 - The Financial Market Commission (CMF) published today its Report on the Performance of the Banking System and Cooperatives as of July 2025. It contains data about activity, risk, and results of supervised banks and cooperatives. Key figures are presented below, while the full report is available here.
| Results of the Banking Industry |
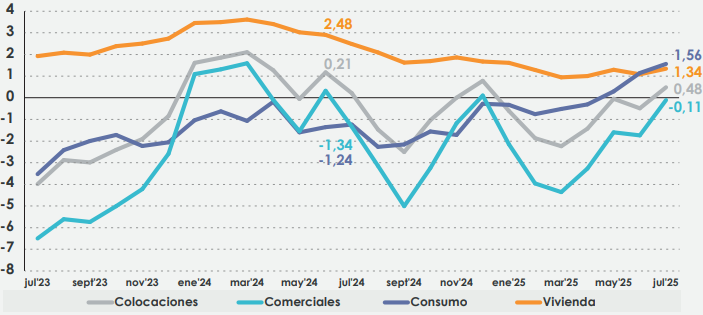
Loans in the banking system recovered, posting a growth of 0.48 percent (real terms) over 12 months due to a lower decline in the commercial portfolio. Meanwhile, consumer loans increased for the third consecutive month and housing loans grew slightly but over the figures recorded in June.
Total loans and loans by portfolio, banking system
(Real annual variation expressed in percentage)

Gray: Total loans. Aqua: Commercial loans. Purple: Consumer loans. Orange: Housing loans.
As for credit risk indices, all of them fell in the consumer portfolio and most of them fell in the commercial portfolio, while all housing indices rose. Indices show uneven behaviors versus 12 months ago: all housing indices grew while most of them fell in the commercial and housing portfolios. Provisions coverage increased both versus last month and a year ago.
Cumulative profits grew due to lower taxes and operational expenses coupled with increased net income from fees. These compensated for drops in interest and readjustment margins. Better figures impact profitability indices compared to a year ago: the return on average equity moves to 15.53 percent and the return on average assets to 1.34 percent.
| Loans |
|---|
|
USD 278,994 million 0.48% Real variation over 12 months |
| Risk Indices |
|---|
|
Loan-Loss Provisions Index |
|
2.57% |
|
Arrears Ratio of 90 Days or More |
|
2.3% |
| Profits |
|---|
|
USD 321 million 6.25% Real variation over 12 month |
| Results of Savings and Credit Cooperatives |
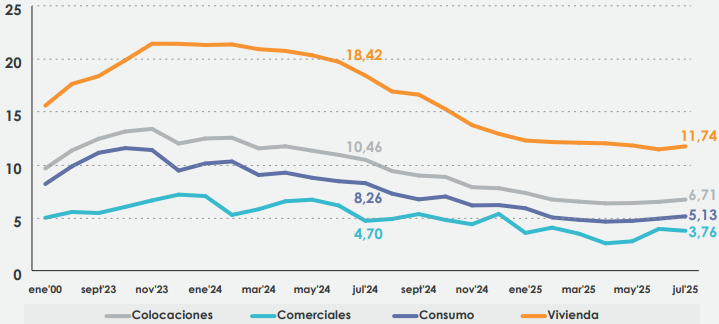
Loans granted by savings and credit cooperatives recorded a slight growth compared to June, but below the figures of a year ago. The consumer portfolio, which represents 69.59 percent of total operations, expanded by 5.13 percent in real terms over 12 months and is the main reason behind this result.
Total loans and loans by portfolio, savings and credit cooperatives
(Real annual variation expressed in percentage)

Gray: Total loans. Aqua: Commercial loans. Purple: Consumer loans. Orange: Housing loans.
There is an increase in credit risk indices versus June. All consumer indices rose, while commercial and housing indices fall except for the consumer's portfolio impaired portfolio ratio, which showed no variation.
Increased interest margins led to higher results in July, but support expenses also grew during the month. These higher profits also impacted profitability indices compared to last year, with the return on average equity reaching 14.08 percent and the return on average assets 2.94 percent.
| Loans |
|---|
|
USD 3,441 million 6.71% Real variation over 12 months |
| Risk Indices |
|---|
|
Provisions Index |
|
4.06% |
|
Arrears Ratio of 90 Days or More |
|
2.38% |
| Results |
|---|
|
USD 5 million 35.09% Real variation over 12 month |


