
The Financial Market Commission released today the 6th version of its Annual Regional Banking Statistics Report, which provides data of financial activity at a regional level to evaluate local economies based on access to and coverage of banking services and products.
This year's edition features a number of improvements versus previous versions. These include a regional analysis of savings and credit cooperatives; mortgage mutual fund managers; and non-payment banking card issuers, all of which are permanently added to the Report.
Increased Coverage of Cash Management and Savings Products
Population coverage for both cash management products (checking and demand accounts) and savings accounts increased nationwide over the past year. There is over one account per natural person, while legal persons show significantly lower coverage levels, especially outside the Metropolitan Region).
Graph 1: Cash management and savings products in the financial system per region and client type
(Number of accounts every 100,000 people or businesses)
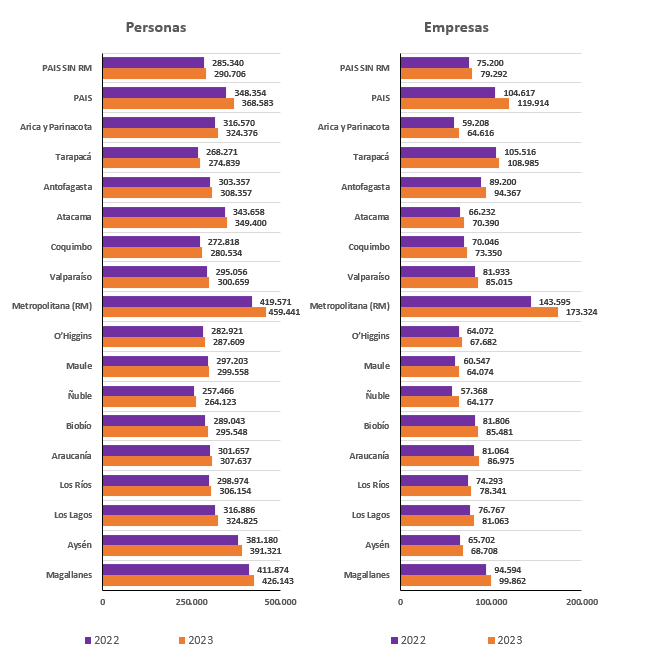
Data as of June of each year. Includes banks and cooperatives. For natural persons, the amount considers persons 15 years of age or older. In the case of companies (legal persons), the latest information on the business universe published by the Internal Revenue Service is used. Source: CMF.
Despite increases in population coverage, average balances in cash management products fell across the country, as did balance on term savings accounts.
Graph 2: Balances in deposit accounts
(Real annual variation in percentage as of June 2023).
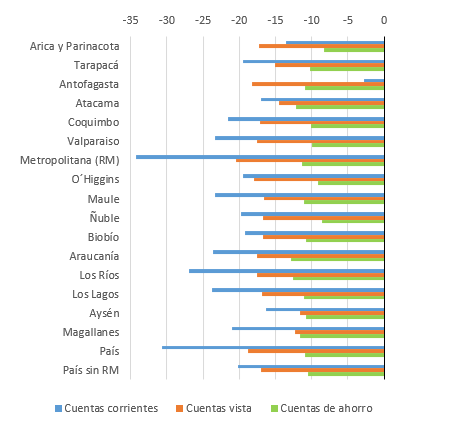
Blue: Checking accounts. Orange: Demand accounts. Green: Savings accounts. Source: CMF.
Evolution of Loans
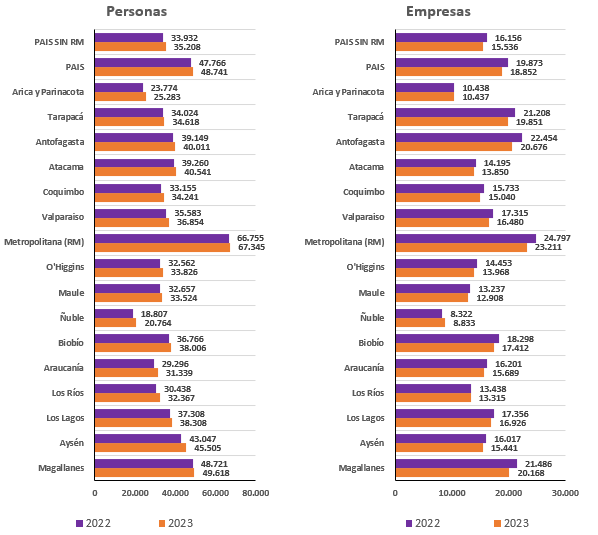
Population coverage of financial system debtors increased in all regions for natural persons. This contrasts with that of legal persons, which decreased across the board apart from the Ñuble Region.
Population coverage of loans reached its highest levels in the banking industry, followed by non-bank card issuers. On the other hand, cooperatives and mortgage mutual fund managers show less coverage, especially for legal persons. Some regions do not register any lending activity for companies by these financial institutions.
Graph 3: Financial system debtors per client type and region
(Number of debtors every 100,000 people of businesses)
Branches
As of June 2023, there were 17 active banking institutions in Chile, with a total of 1,561 branches distributed among headquarters, branches, auxiliary offices, and support offices. This means a decrease compared to the 1,640 offices existing as of June 2022. Of this decrease, 72 percent (57 offices) was in the Metropolitan region.
Likewise, there was a decrease in the number of ATMs: as of June 2023, there were a total of 7,588 machines distributed among 11 institutions, reducing the number of ATMs by 14. However, when disaggregated by region, data shows that there was a decrease of 53 ATMs in the Metropolitan region, while in other regions the number of ATMs increased. Among factors explaining the decline in the number of ATMs is the progress in digitalization of banking operations in recent years.
Graph 4: Traditional networks (bank branches and ATMs) per region
(Number of physical locations per 100,000 people; also includes communes with no branch coverage).
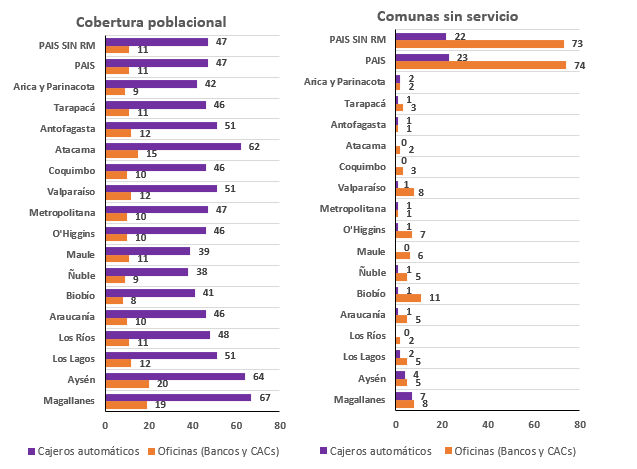
Left graph: Population coverage. Right graph: Communes with no coverage. Purple: ATMs. Orange: Physical branches. Source: CMF.