

The average time from the filing of the claim until the vehicle was available for pickup by policyholders reached 74 days, slightly less than the average of 76 days during the second half of 2022. The time elapsed from the vehicle's entry into the workshop until it was available for pickup remained at 37 days.
On the CMF website, interested parties can check and compare repair times by company, vehicle brand and model, and type of workshop.
The Financial Market Commission (CMF) reports on the average repair time of motor vehicles as of the first semester of 2023.
In June, the Commission launched a new platform on its website to check and compare repair times for vehicles that suffer a claim and are covered by general insurance companies supervised by the CMF. Interested parties can access data about repair times by company, vehicle brand and model, and magnitude of the damage, as well as repair shops in the country. The information on repair times is provided by general insurance companies pursuant to Circular Letter No. 2,236, dated March 6, 2018, which regulates the submission of information related to the process of repairing motor vehicles.
The platform is designed for use by policyholders, people planning to take out insurance, and insurance brokers providing advice on the matter.
Main Results
In the first half of 2023, there were 95,921 insured vehicles with claims, a decrease of 4.4 percent compared to the second half of the 2022 (100,324 claims).
Table 1: Number of insured vehicles by deductible range
|
Deductible |
Vehicles w/Claims |
Percentage |
|
No Deductible |
21,954 |
22.89 |
|
Under UF 5 |
56,615 |
59.02 |
|
Between UF 5 and 10 |
14,356 |
14.97 |
|
Over UF 10 |
2,996 |
3.12 |
|
Total |
95,921 |
100 |
As Graph 1 shows, the average time from the filing of the claim until the vehicle was available for pickup by policyholders reached 74 days, slightly less than the average of 76 days during the second half of 2022.
Graph 1: Average time from the time the claim was filed until the vehicle was available for pickup
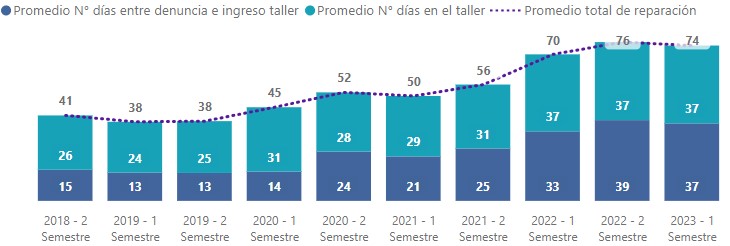
Blue: Average days between filing the claim and sending the vehicle to a workshop. Green: Days the vehicle spent in the workshop. Dotted Purple: Total repair time.
Meanwhile, the time elapsed from the vehicle's entry into the workshop until it was available for pickup remained at 37 days (no variation versus the second half of 2022).
Graph 2: Average days in workshops and number of vehicles with filed claims
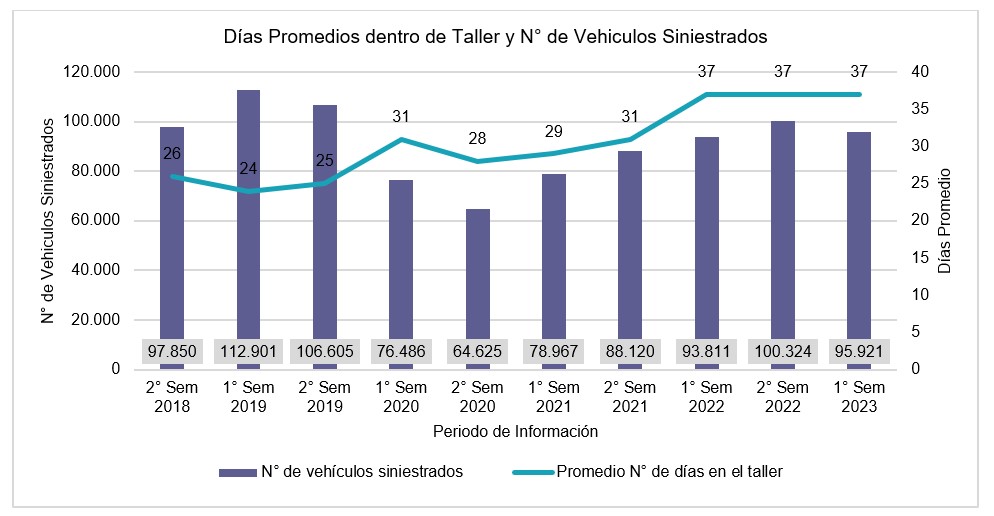
Purple: Number of vehicles with claims. Green: Average days vehicles spent in workshops.
As Table 2 shows, repair times by insurance company vary significantly depending on the extent of damage to vehicles.
Table 2: Average time by company for vehicles entering workshops until being available for pickup
|
Insurance Company |
Light Damage |
Medium Damage |
Heavy Damage |
Total |
||||
|
Vehicles w/Claims |
Average Days |
Vehicles w/Claims |
Average Days |
Vehicles w/Claims |
Average Days |
Vehicles w/Claims |
Average Days |
|
|
BCI |
10,354 |
37 |
8,437 |
51 |
9,672 |
72 |
28.463 |
53 |
|
BNP |
693 |
17 |
536 |
22 |
504 |
29 |
1.733 |
22 |
|
Consorcio Nacional |
2,851 |
16 |
1,796 |
21 |
2,099 |
31 |
6.746 |
22 |
|
FID |
295 |
19 |
147 |
23 |
139 |
35 |
581 |
24 |
|
HDI |
9,211 |
20 |
5,780 |
26 |
6,015 |
40 |
21.006 |
27 |
|
Liberty |
4,412 |
32 |
2,075 |
35 |
2,420 |
35 |
8.907 |
33 |
|
Mapfre |
2,473 |
21 |
1,398 |
27 |
1,205 |
35 |
5.076 |
26 |
|
Porvenir |
179 |
13 |
127 |
28 |
35 |
58 |
341 |
23 |
|
Reale |
2,210 |
21 |
1,386 |
26 |
1,422 |
40 |
5.018 |
28 |
|
Renta Nacional |
968 |
19 |
582 |
24 |
844 |
43 |
2.394 |
29 |
|
Suramericana G |
2,236 |
18 |
1,971 |
25 |
1,709 |
40 |
5.916 |
27 |
|
Zenit |
1,134 |
37 |
923 |
50 |
989 |
72 |
3.046 |
52 |
|
Zurich Chile G |
3,009 |
43 |
1.902 |
49 |
1.783 |
59 |
6.694 |
49 |
|
Total |
40,025 |
28 |
27,060 |
36 |
28,836 |
52 |
95,921 |
37 |
As of the closing date of this report, there were 5,151 insurance company agreements with repair shops (repair shops may work with more than one company). The average number of insured vehicles per agreement was 377. Of the total number of repair shops, 36% are in the Metropolitan Region.
Table 3: Repair shops by region
|
Region |
No. of Repair Shops |
Percentage |
|
Arica y Parinacota |
36 |
1 |
|
Tarapacá |
80 |
2 |
|
Antofagasta |
274 |
5 |
|
Atacama |
137 |
3 |
|
Coquimbo |
260 |
5 |
|
Valparaíso |
511 |
10 |
|
Metropolitana |
1,835 |
36 |
|
Libertador Bernardo O'Higgins |
255 |
5 |
|
Maule |
370 |
7 |
|
Ñuble |
128 |
2 |
|
Bío Bío |
374 |
7 |
|
Araucanía |
220 |
4 |
|
Los Ríos |
110 |
2 |
|
Los Lagos |
387 |
8 |
|
Aysén |
43 |
1 |
|
Magallanes |
131 |
3 |
|
Total |
5,151 |
100 |
The total number of insured vehicles nationwide as of the first half of 2023 is 1,942,068, a decrease of 49,245 compared to the second half of 2022. Meanwhile, the claim ratio for insured vehicles reached 4.9 percent, slightly lower than the 5 percent of the previous semester. This figure includes all types of non-commercial vehicles.
Graph 3: Number of insured vehicles and claims rate by semester
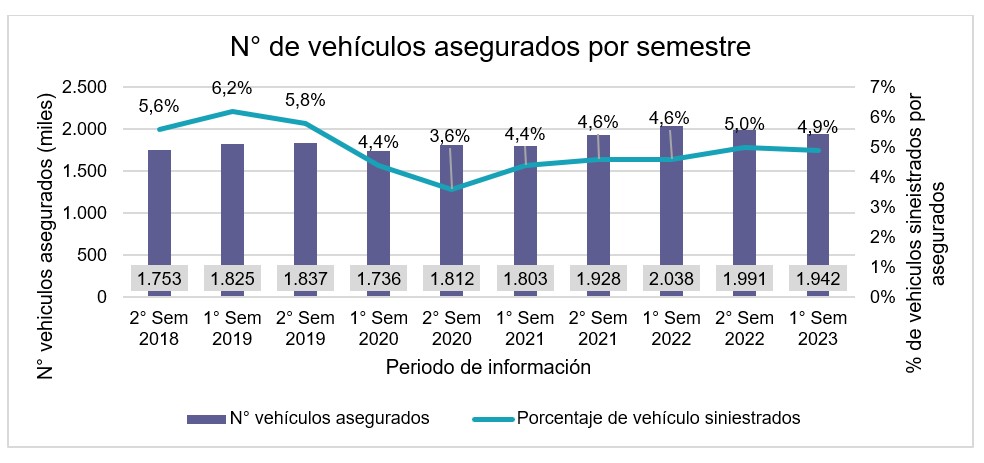
Purple: Number of vehicles. Green: Rate of filed claims.