- On the CMF website, individuals can find out the average number of days it takes to repair a vehicle by insurance company; brand and model of the vehicle; magnitude of damage; and deductible established in the corresponding policy.
- The average time from admission into the workshop until the vehicle is available for pick-up by the policyholder reached 28 days in the second half of 2020. This figure varies depending on the magnitude of the damage.
- There were 64,607 vehicle casualties reported due to the Covid-19 pandemic, 39 percent less than the second half of 2019.
The Financial Market Commission (CMF) reports on average motor vehicle repair times as of the second half of 2020. This information is reported to the CMF on a semi-annual basis by insurance companies, in compliance with Circular Letter No. 2,236 from March 6, 2018. Said regulation sets forth rules for the submission of information related to repair processes of motor vehicles.
The platform available on the CMF website includes semi-annual information since 2018 on cars, vans and motorcycles for non-commercial use and partial losses that required the repair or replacement of parts and pieces. This applies to claims by both policyholders and affected third parties whose repair process was completed during the consulted period.
The objective of the platform developed by the Commission is to provide information to be used by both policyholders and insurance brokers who provide advice to individuals seeking to take out insurance.
Main Results
In the second half of 2020, there were 64,607 insured vehicles damaged. Most cases involved payment of a deductible.
Table 1: Number of damaged vehicles by deductible
|
Deductible (CLP) |
No. of Claims |
Percentage |
|
None |
15,705 |
24.3 |
|
1 to 80,000 |
11,075 |
17.1 |
|
80,001 to 130,000 |
19,726 |
30.5 |
|
131,000 to 250,000 |
13,430 |
20.8 |
|
Over 250,001 |
4,671 |
7.2 |
|
Total |
64,607 |
100.0 |
By magnitude of damage, 53 percent of the claims reported were in the minor category, as seen in Table 2.
Table 2: Number of damaged vehicles by magnitude and deductible
|
Deductible (CLP) |
Minor Damage |
Moderate Damage |
Severe Damage |
Total |
||||
|
None |
9,901 |
28.9 |
3,400 |
20.2 |
2,404 |
17.8 |
15,705 |
24.3 |
|
1 to 80,000 |
5,972 |
17.4 |
2,997 |
17.8 |
2,106 |
15.6 |
11,075 |
17.1 |
|
80,001 to 130,000 |
10,037 |
29.3 |
5,415 |
32.1 |
4,274 |
31.7 |
19,726 |
30.5 |
|
130,001 to 250,000 |
6,057 |
17.7 |
3,850 |
22.8 |
3,523 |
26.1 |
13,430 |
20.8 |
|
Over 250,001 |
2,289 |
6.7 |
1,198 |
7.1 |
1,184 |
8.8 |
4,671 |
7.2 |
|
Total |
34,256 |
100.0% |
16,860 |
100.0% |
13,491 |
100.0% |
64,607 |
100.0% |
The magnitude of damage is defined by the range of the vehicle and the total repair cost. They are classified into the following categories.
|
Magnitude of Damage |
Low/Medium Range |
High Range |
|
Minor |
UF 0 to 20 |
UF 0 to 40 |
|
Moderate |
UF 20.01 to 40 |
UF 40.01 to 80 |
|
Severe |
Over UF 40.01 |
Over UF 80.01 |
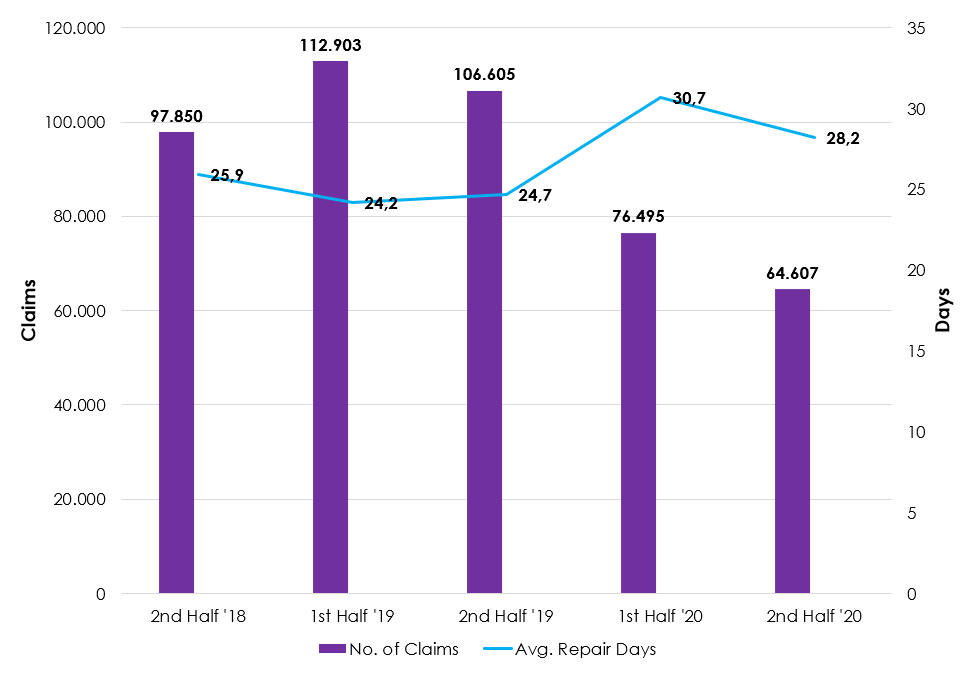
The average time measured from the time the vehicle enters the workshop until it is available for pick-up by the policyholder reached 28 days on average. However, the number of vehicles affected by accidents decreased. It's a slight improvement compared to the 30.7 days recorded in the first half of 2020, though still worse than previous halves.
Graph 1. Number of damaged vehicles and average time elapsed from date of entry into workshop to date on which the vehicle is available to the policyholder
As seen in Table 3, repair times by insurance company vary significantly depending on the vehicle's magnitude of damage.
Table 3: Average time by insurance company from date of entry into workshop to date until the vehicle is available to the policyholder
|
Insurance Company |
Minor Damage |
Moderate Damage |
Severe Damage |
|||
|
No. of Claims |
Avg. Days |
No. of Claims |
Avg. Days |
No. of Claims |
Avg. Days |
|
|
BCI |
7,843 |
25.2 |
5,359 |
32.1 |
4,207 |
46.3 |
|
BNP |
91 |
15.1 |
40 |
22.2 |
38 |
26.4 |
|
Chilena Consolidada |
4,692 |
13.5 |
1,480 |
18.6 |
1,052 |
22.3 |
|
Consorcio |
2,388 |
14.3 |
1,278 |
18.1 |
1,242 |
30.4 |
|
FID |
152 |
13.7 |
76 |
25.3 |
51 |
30.5 |
|
HDI |
6,782 |
26 |
3,274 |
35.6 |
2,739 |
51.3 |
|
Liberty |
6,188 |
28.6 |
2,030 |
34.8 |
1,688 |
35.3 |
|
Mapfre |
1,842 |
19.1 |
668 |
23.8 |
408 |
29 |
|
Porvenir |
58 |
11.6 |
27 |
21.8 |
12 |
29.3 |
|
Reale |
948 |
14.3 |
550 |
17.3 |
516 |
26.3 |
|
Renta Nacional |
472 |
17.6 |
252 |
27.6 |
311 |
36.9 |
|
Suramericana |
1,999 |
16.7 |
1,253 |
26.2 |
798 |
51.1 |
|
Zenit |
801 |
29.5 |
573 |
36.4 |
429 |
48 |
|
Total |
34,256 |
22.4 |
16,860 |
29.6 |
13,491 |
41.3 |
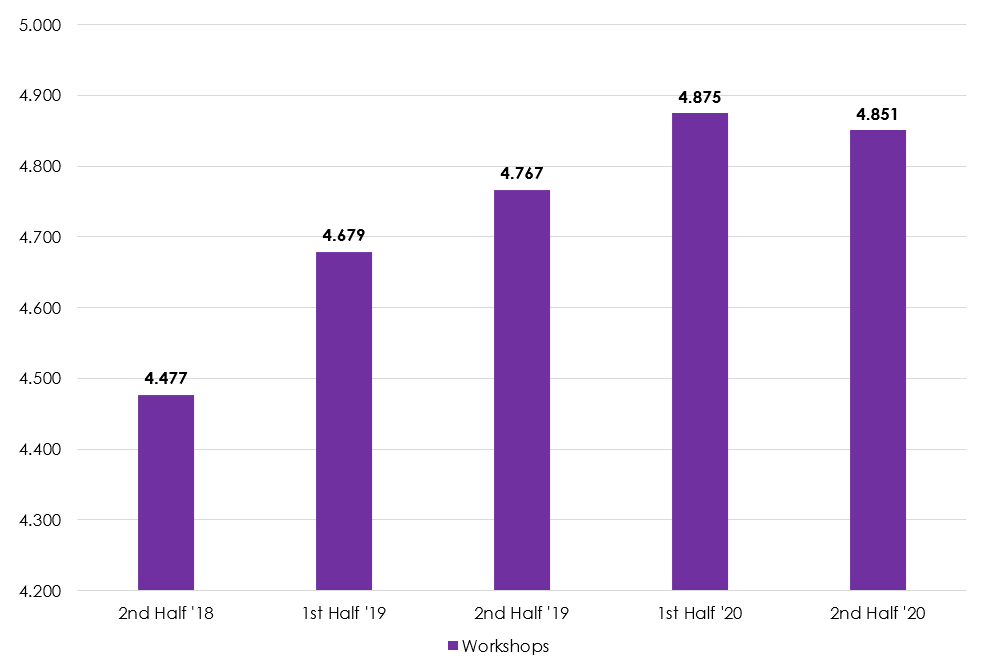
Since 2018, insurance companies have increased the number of workshops under agreement apart from the second half of 2020, which experienced a slight decrease of 0.5 percent.
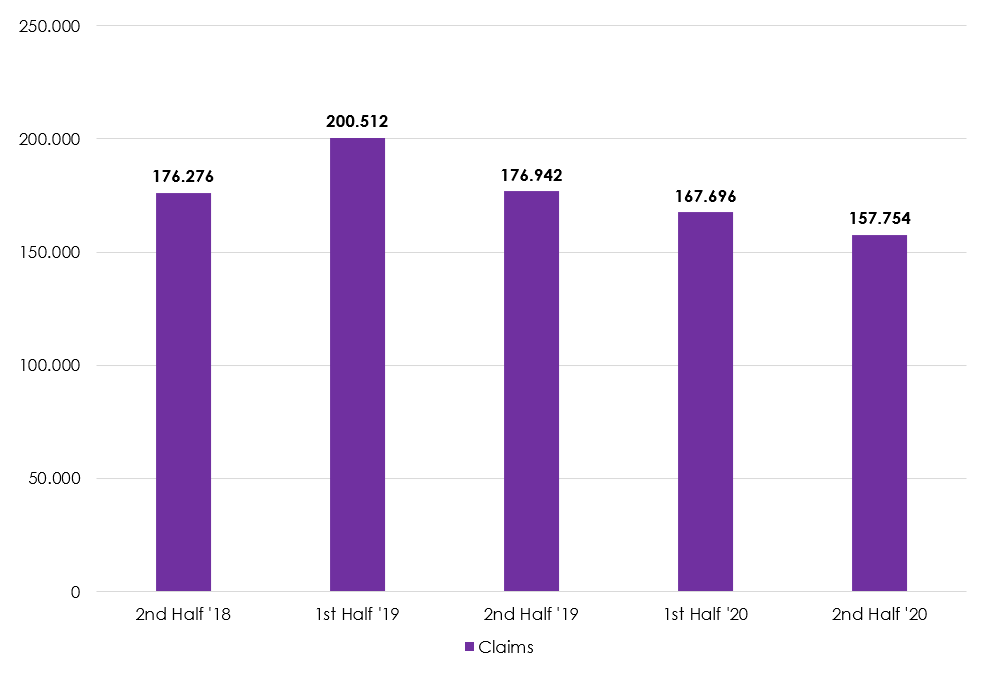
The total number of insured vehicles as of the second half of 2020 increased by 100,000 compared to the first half, reaching the levels seen back in 2019. This figure includes all types of vehicles (light, heavy, commercial, and private).

On the other hand, the number of claims received by insurance companies during the reported period associated to non-commercial motor vehicles with partial loss recorded a decrease starting in the second half of 2019, with drops of 5 and 6 percent, respectively, during the two halves of 2020.