- On the CMF website, individuals can find out the average number of days it takes to repair a vehicle by insurance company; brand and model of the vehicle; magnitude of damage; and deductible established in the corresponding policy.
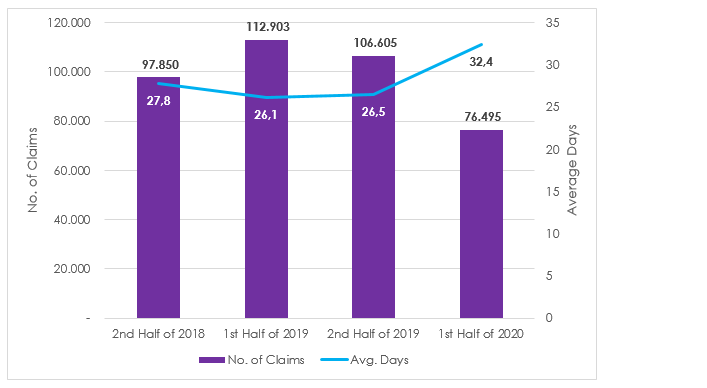
- The average time from admission into the workshop until the vehicle is available for pick-up by the policyholder reached 32.4 days in the first semester. This figure varies significantly depending on the magnitude of the damage.
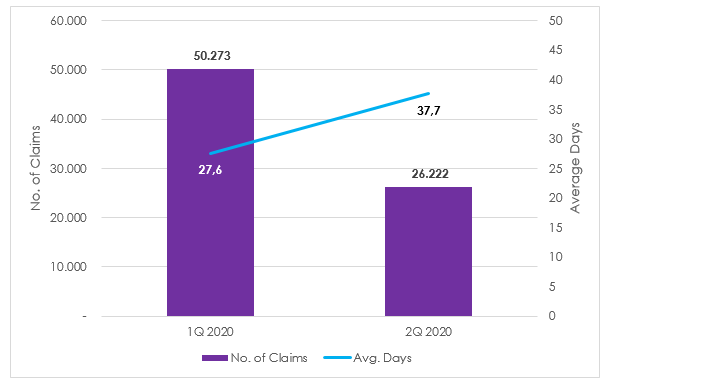
- Between the first and second quarters, following the start of the lockdown due to the Covid-19 pandemic, there was a drop in the number of reported casualties and an increase in repair times.
September 3, 2020 - The Financial Market Commission (CMF) reports on average motor vehicle repair times as of the first half of 2020. This information is reported to the CMF on a semi-annual basis by insurance companies, in compliance with Circular Letter No. 2,236 from March 6,2018. Said regulation sets forth rules for the submission of information related to repair processes of motor vehicles.
The platform available on the CMF website includes semi-annual information since 2018 on cars, vans and motorcycles for non-commercial use and partial losses that required the repair or replacement of parts and pieces. This applies to claims by both policyholders and affected third parties whose repair process was completed during the consulted period.
The objective of the platform developed by the Commission is to provide information to be used by both policyholders and insurance brokers who provide advice to individuals seeking to take out insurance.
Results
In the first half of 2020, there were 76,495 insured vehicles damaged. Most of said cases involved payment of a deductible.
Table 1: Number of damaged vehicles by deductible
|
Deductible (CLP) |
No. of Claims |
Percentage |
|
None |
18,855 |
24.6 |
|
1 to 80,000 |
12,158 |
15.9 |
|
80,001 to 130,000 |
23,721 |
31.0 |
|
130,001 to 250,000 |
15,957 |
20.9 |
|
Over 250,001 |
5,804 |
7.6 |
|
Total |
76,495 |
100.0 |
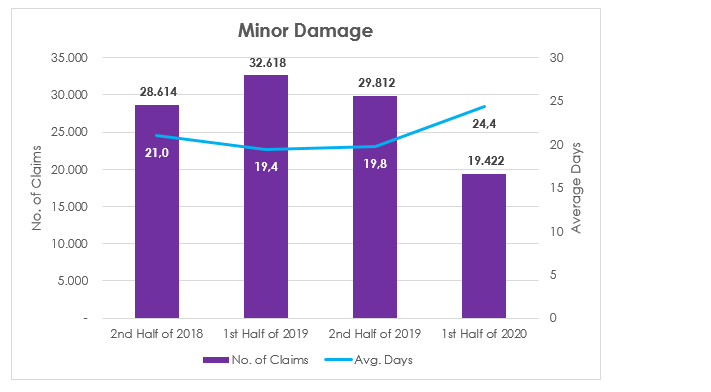
By magnitude of damage, 45 percent of the claims reported were in the minor category, as seen in Table 2.
Table 2: Number of damaged vehicles by magnitude of damage and deductible
|
Deductible (CLP) |
Minor Damage |
Moderate Damage |
Severe Damage |
Total |
||||
|
None |
10,440 |
29.8% |
5,729 |
22.3% |
2,686 |
17.1% |
18,855 |
24.6% |
|
1 to 80,000 |
4,870 |
13.9% |
5,212 |
20.3% |
2,076 |
13.2% |
12,158 |
15.9% |
|
80,001 to 130,000 |
10,688 |
30.5% |
8,043 |
31.3% |
4,990 |
31.7% |
23,721 |
31.0% |
|
130,001 to 250,000 |
6,681 |
19.1% |
5,066 |
19.7% |
4,210 |
26.8% |
15,957 |
20.9% |
|
Over 250,001 |
2,388 |
6.8% |
1,657 |
6.4% |
1,759 |
11.2% |
5,804 |
7.6% |
|
Total |
35,067 |
100.0% |
25,707 |
100.0% |
15,721 |
100.0% |
76,495 |
100.0% |
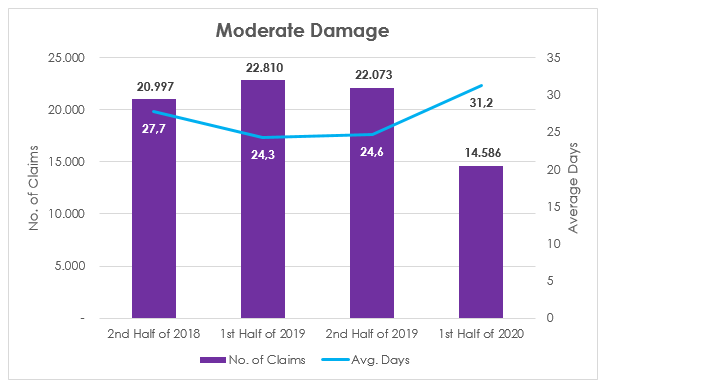
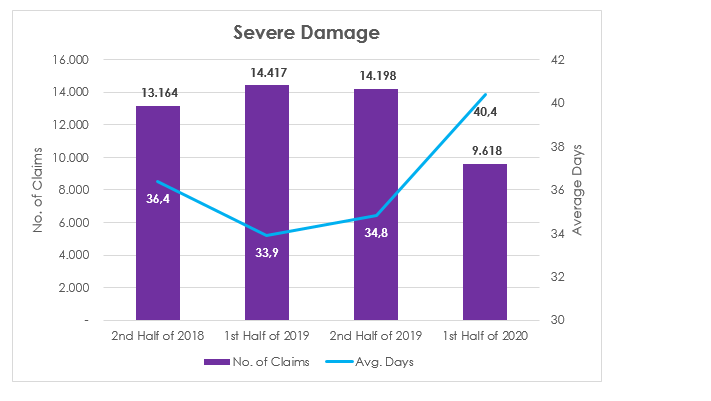
The magnitude of damage is defined by the range of the vehicle and the total repair cost. They are classified into the following categories.
|
Magnitude of Damage |
Low/Medium Range |
High Range |
|
Minor |
UF 0 to 20 |
UF 0 to 40 |
|
Moderate |
UF 20.01 to 40 |
UF 40.01 to 80 |
|
Severe |
Over UF 40.01 |
Over UF 80.01 |
The average time measured from the time the vehicle enters the workshop until it is available for pick-up by the policyholder increased in the first semester compared to earlier periods, with an average of 32.4 days. However, the number of vehicles affected by accidents decreased. This was due to the limitations of workshop operations during the Covid-19 pandemic, which is evident by splitting data for this year in two quarters, as seen in Graph 1.
Graph 1. Number of damaged vehicles and average time elapsed from date of entry into workshop to date on which the vehicle is available to the policyholder
As seen in Table 3, repair times by insurance company vary significantly depending on the magnitude of damage to the vehicle.
Table 3: Average time by insurance company from date of entry into workshop to date until the vehicle is available to the policyholder
|
Ins. Company |
Minor Damage |
Moderate Damage |
Severe Damage |
|||
|
No. of Claims |
Avg. Days |
No. of Claims |
Avg. Days |
No. of Claims |
Avg. Days |
|
|
BCI |
9,520 |
22.7 |
6,509 |
28.4 |
5,692 |
39.9 |
|
BNP Paribas |
99 |
12.1 |
40 |
19.0 |
27 |
26.7 |
|
Chilena Consolidada |
0 |
0.0 |
7,164 |
34.5 |
0 |
0.0 |
|
Consorcio |
2,752 |
14.5 |
1,562 |
18.9 |
1,713 |
27.9 |
|
FID Chile |
30 |
17.6 |
20 |
25.5 |
16 |
17.0 |
|
HDI |
6,886 |
37.9 |
3,201 |
45.1 |
2,577 |
55.4 |
|
Liberty |
8,365 |
30.4 |
3,027 |
36.5 |
2,565 |
40.2 |
|
Mapfre |
2,202 |
18.7 |
986 |
24.7 |
632 |
31.7 |
|
Porvenir |
172 |
18.7 |
69 |
32.3 |
42 |
38.1 |
|
Reale |
1,516 |
17.1 |
949 |
23.6 |
891 |
35.1 |
|
Renta Nacional |
743 |
17.4 |
381 |
24.4 |
336 |
32.3 |
|
Suramericana |
1,829 |
13.9 |
1,214 |
20.7 |
759 |
29.6 |
|
Zenit |
953 |
22.3 |
585 |
29.1 |
471 |
35.5 |
|
Total |
35,067 |
20.3 |
25,707 |
27,9 |
15,721 |
34.1 |
There is also an increase in repair times in the Metropolitan Region, depending on the magnitude of the damage, as seen in Graph 2.
Graph 2. Number of damaged vehicles in the Metropolitan Region and average time elapsed from date of entry into workshop to date on which the vehicle is available to the policyholder